
Planet PHP
Guest
It's been 15 years since Xdebug first came out. We think this is the perfect opportunity to re-introduce it to the world, and explain how and why it does what it does.

Xdebug is a PHP extension (meaning it needs to be compiled and installed into a PHP installation) which provides the developer with some features for debugging. Those include:
Xdebug comes with a detailed installation page which handles most if not all use cases, but if you'd like to play with the functionality presented below, we recommend using Homestead Improved which comes with the extension pre-installed and activated.
With modern IDEs and Blackfire, is there even a need for Xdebug?
IDEs do provide good code lookup functionality, so the link format functionality's usefulness can seem questionable. There's also loggers of all kinds now which can handle errors and exceptions. Likewise, function traces and profiling are done really well in Blackfire. However, file link formats are just one part of Xdebug, and using Blackfire has its own hurdles - installing the extension, setting up the keys, and then paying to keep trace history. Loggers also need to be used with a lot of foresight, and aren't very easy to add into an application later on.
There's more to Xdebug than just this, though - it's still required for proper unit testing (testing frameworks depend on it for code coverage reports), it's far from easy to get remote break-point debugging going via other means, and it's a tool so old and stable it's been ironed out to near perfection.
If your current tools can handle everything it offers or you don't need the features it offers then of course, there's no need for Xdebug, but I've yet to start a single project that could be completed just as efficiently without it.
Let's Try It Out
I'll assume you have a working Xdebug installation at this point. If not, please consider using Homestead Improved.
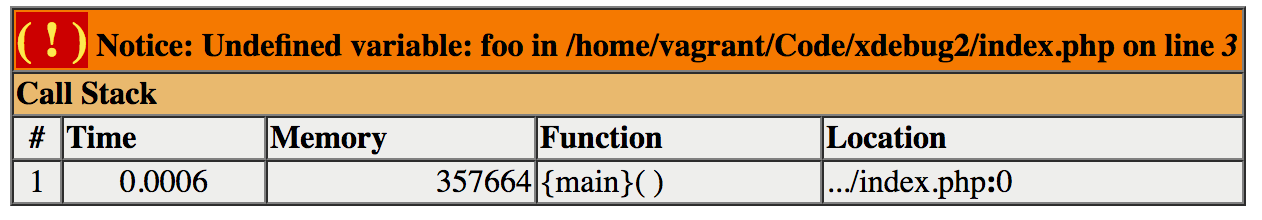
Let's make a new project folder with a simple index.php file, and echo out a non-existent variable like $foo:
<?php
echo $foo;
This is what we get:
Turning Xdebug Off
Screens like these are so ubiquitous these days, and such a common default, that most people don't even realize this is already Xdebug-styled. To prove it, let's see how it looks without Xdebug. To disable Xdebug, we edit the file /etc/php/7.1/fpm/conf.d/20-xdebug.ini in Homestead Improved, and comment out the first line:
;zend_extension=xdebug.so
xdebug.remote_enable = 1
xdebug.remote_connect_back = 1
xdebug.remote_port = 9000
xdebug.max_nesting_level = 512
We need to restart PHP-FPM afterwards:
sudo service php7.1-fpm restart
Continue reading %Getting to Know and Love Xdebug%
Читать дальше...
Xdebug is a PHP extension (meaning it needs to be compiled and installed into a PHP installation) which provides the developer with some features for debugging. Those include:
- stack traces - detailed output of the path the application took to reach a given error, including parameters passed to functions, in order to easily track the error down.
- a prettier var_dump output which produces color coded information and structured views, similar to VarDumper, along with a a super-globals dumper
- a profiler for finding out where the bottlenecks in your code are, and the ability to visualize those performance graphs in external tools. What this results in is a graph similar to that which Blackfire produces.
- a remote debugger which can be used to remotely connect Xdebug with running code and an end-client like an IDE or a browser to step through breakpoints in code and execute line by line of your application.
- code coverage which tells you how much of your code was executed during a request. This is almost exclusively meant to help with unit tests and finding our how much of your code is test-covered.
Xdebug comes with a detailed installation page which handles most if not all use cases, but if you'd like to play with the functionality presented below, we recommend using Homestead Improved which comes with the extension pre-installed and activated.
With modern IDEs and Blackfire, is there even a need for Xdebug?
IDEs do provide good code lookup functionality, so the link format functionality's usefulness can seem questionable. There's also loggers of all kinds now which can handle errors and exceptions. Likewise, function traces and profiling are done really well in Blackfire. However, file link formats are just one part of Xdebug, and using Blackfire has its own hurdles - installing the extension, setting up the keys, and then paying to keep trace history. Loggers also need to be used with a lot of foresight, and aren't very easy to add into an application later on.
There's more to Xdebug than just this, though - it's still required for proper unit testing (testing frameworks depend on it for code coverage reports), it's far from easy to get remote break-point debugging going via other means, and it's a tool so old and stable it's been ironed out to near perfection.
If your current tools can handle everything it offers or you don't need the features it offers then of course, there's no need for Xdebug, but I've yet to start a single project that could be completed just as efficiently without it.
Let's Try It Out
I'll assume you have a working Xdebug installation at this point. If not, please consider using Homestead Improved.
Let's make a new project folder with a simple index.php file, and echo out a non-existent variable like $foo:
<?php
echo $foo;
This is what we get:
Turning Xdebug Off
Screens like these are so ubiquitous these days, and such a common default, that most people don't even realize this is already Xdebug-styled. To prove it, let's see how it looks without Xdebug. To disable Xdebug, we edit the file /etc/php/7.1/fpm/conf.d/20-xdebug.ini in Homestead Improved, and comment out the first line:
;zend_extension=xdebug.so
xdebug.remote_enable = 1
xdebug.remote_connect_back = 1
xdebug.remote_port = 9000
xdebug.max_nesting_level = 512
We need to restart PHP-FPM afterwards:
sudo service php7.1-fpm restart
Continue reading %Getting to Know and Love Xdebug%
Читать дальше...