
Mark Callaghan
Guest
What is a typical InnoDB redo log size? By size I mean the product of innodb_log_file_size and innodb_log_files_in_group. A typical setup for me is 4gb via 2gb/file and 2 files.
Using a large InnoDB redo log can help performance but it comes at a cost. I have been using a 4gb redo log in my tests because that is what we frequently use in production. Dimitri mentioned using a 32gb redo log to show great throughput for InnoDB in recent releases. Here I share results from the insert benchmark with a 4gb, 8gb, 16gb and 32gb redo log.
tl;dr - conclusions specific to my test
Configuration
I used my insert benchmark client with two test servers -- one with slow SSD that does ~10k IOPs and one with fast SSD that does more than 100k IOPs. Both servers have 24 cores, 48 HW-threads and 256gb of RAM. Tests were repeated for an in-memory workload (insert 500m rows) and an IO-bound workload (limit server RAM to 50gb and insert 2b rows). The test used 16 tables, 16 clients and each client inserted rows to a different table. Typical command line were:
# insert 500m rows
bash iq.sh innodb "" /path/to/bin/mysql /path/to/datadir md2 \
1 16 no no no 0 no 500000000
# insert 2b rows
bash iq.sh innodb "" /path/to/bin/mysql /path/to/datadir md2 \
1 16 no no no 0 no 2000000000
Test were run with upstream MySQL 5.6.35 and 5.7.17. I used these my.cnf files for 5.7.17 and 5.6.35. I compiled MySQL from source and used jemalloc. The benchmark client ran on the same host as mysqld to remove variance from the network. The binlog is enabled but sync on commit is disabled for InnoDB and the binlog to support faster insert rates.
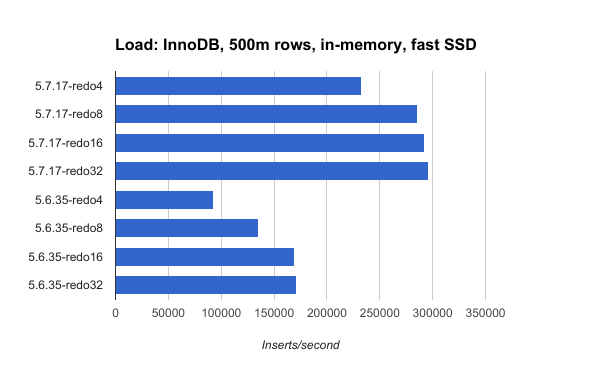
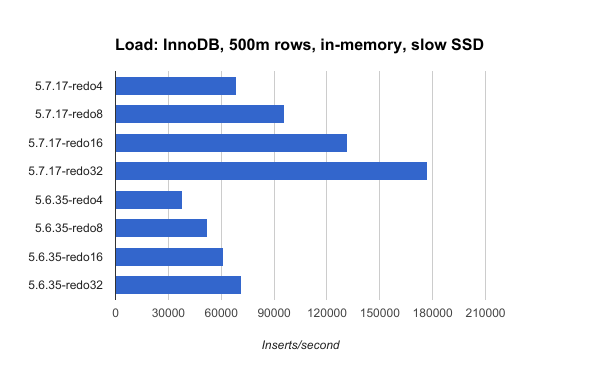
In-memory load
For the in-memory load the redo log size has more impact with slow SSD than with fast SSD. From the In-memory load metrics section below you can see the benefit from a larger redo log. It reduces the amount of data written to storage per insert by more than half (see the wKB/i column) when going from a 4gb to a 32gb redo log. For fast SSD with 5.7.17, InnoDB writes to storage 5.31 KB/insert with a 4gb redo log versus 1.66 KB/insert with a 32gb redo log. Similar reductions occur for slow SSD and for 5.6.35. The larger redo log helps slow SSD more than fast SSD based on the reduction in wKB/i.
In-memory load metrics
Legend:
Fast SSD
ips.av ips.99 wKB/i Mcpu/i size rss wMB/s cpu engine
232666 9925 5.31 176 97 104.4 1235.1 41.0 inno5717.none.150g.redo4
286041 16559 3.46 162 97 104.1 989.0 46.4 inno5717.none.150g.redo8
292740 17587 2.41 157 97 104.3 706.5 46.0 inno5717.none.150g.redo16
295683 18009 1.66 154 97 104.1 490.6 45.5 inno5717.none.150g.redo32
92404 3504 5.11 201 97 106.2 472.5 18.6 inno5635.none.150g.redo4
134844 5987 2.97 192 97 106.1 400.8 25.8 inno5635.none.150g.redo8
169319 9247 2.02 176 97 106.1 342.5 29.8 inno5635.none.150g.redo16
171116 10165 1.74 175 97 106.2 297.9 30.0 inno5635.none.150g.redo32
Slow SSD
ips.av ips.99 wKB/i Mcpu/i size rss wMB/s cpu engine
68672 3277 4.95 165 97 104.4 339.9 11.3 inno5717.none.150g.redo2
95896 4518 2.67 154 97 104.4 256.4 14.7 inno5717.none.150g.redo4
131787 5868 1.47 135 97 104.4 194.2 17.8 inno5717.none.150g.redo8
177179 7231 0.85 130 97 104.3 151.3 23.0 inno5717.none.150g.redo16
38058 1691 5.01 176 97 106.3 190.6 6.7 inno5635.none.150g.redo2
52493 2537 2.74 156 97 106.3 144.0 8.2 inno5635.none.150g.redo4
61043 2660 1.64 151 97 106.3 100.2 9.2 inno5635.none.150g.redo8
71317 2914 1.26 145 97 106.3 89.5 10.3 inno5635.none.150g.redo16
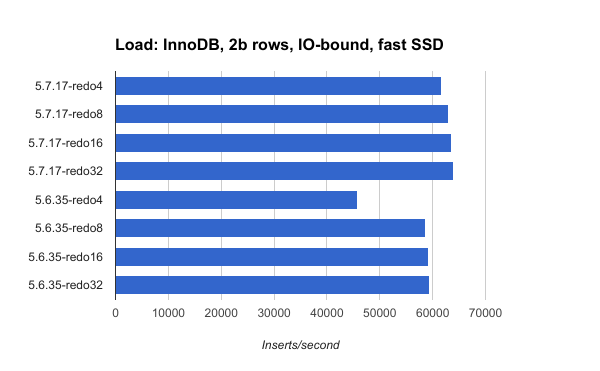
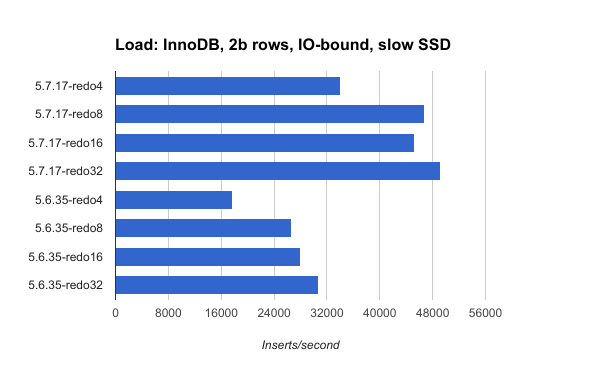
IO-bound load
For the IO-bound load and fast SSD the redo log size has little impact for 5.7.17 and some impact for 5.6.35. For slow SSD the redo log size has more impact. But compared to the in-memory results above the impact from redo log size is much less for the IO-bound workload. From the IO-bound load metrics section below the reduction in wKB/i is less for IO-bound than for in-memory workloads but increasing the redo log from 4gb to 32gb still reduces the write rate in half for slow SSD per the wKB/i column.
Per the ips.av column InnoDB with 5.7.17 isn't much faster than 5.6.35 for the fast SSD. It is still much faster for the slow SSD.
IO-bound load metrics
Fast SSD
ips.av ips.99 r/i rKB/i wKB/i Mcpu/i size rss r/s rMB/s wMB/s cpu engine
61711 3353 0.09 1.48 14.65 562 402 4.0 5698 91.2 904.3 34.7 inno5717.none.35g.redo2
62929 3471 0.09 1.47 11.39 546 402 4.0 5771 92.3 717.0 34.4 inno5717.none.35g.redo4
63593 2542 0.10 1.54 11.01 554 404 4.0 6133 98.1 700.2 35.2 inno5717.none.35g.redo8
63959 3419 0.09 1.43 10.11 535 402 4.0 5732 91.7 646.6 34.2 inno5717.none.35g.redo16
45874 1790 0.11 1.71 11.25 585 402 43.2 4915 78.6 516.0 26.8 inno5635.none.35g.redo2
58682 2500 0.10 1.55 8.57 589 403 43.2 5667 90.7 502.8 34.6 inno5635.none.35g.redo4
59179 2285 0.10 1.52 8.30 581 402 43.2 5607 89.7 491.2 34.4 inno5635.none.35g.redo8
59312 2473 0.10 1.56 8.36 593 403 43.2 5776 92.4 495.7 35.2 inno5635.none.35g.redo16
Slow SSD
ips.av ips.99 r/i rKB/i wKB/i Mcpu/i size rss r/s rMB/s wMB/s cpu engine
34101 1975 0.10 1.60 10.91 402 400 39.7 3412 54.6 372.0 13.7 inno5717.none.35g.redo2
46712 1837 0.09 1.49 7.29 433 403 39.9 4362 69.8 340.7 20.2 inno5717.none.35g.redo4
45231 1649 0.10 1.54 5.34 420 404 40.0 4355 69.7 241.5 19.0 inno5717.none.35g.redo8
49244 1750 0.10 1.56 6.39 454 403 40.0 4803 76.9 314.5 22.4 inno5717.none.35g.redo16
17654 605 0.18 2.79 12.22 448 398 43.2 3083 49.3 215.7 7.9 inno5635.none.35g.redo2
26607 863 0.12 1.86 7.56 438 402 43.2 3099 49.6 201.2 11.7 inno5635.none.35g.redo4
28069 1143 0.09 1.51 5.50 398 403 43.2 2650 42.4 154.2 11.2 inno5635.none.35g.redo8
30734 1276 0.09 1.50 5.01 407 403 43.2 2882 46.1 153.9 12.5 inno5635.none.35g.redo16
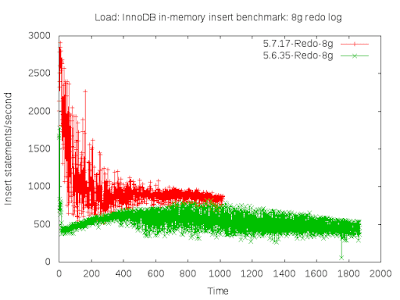
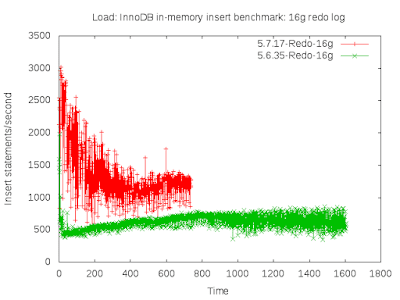
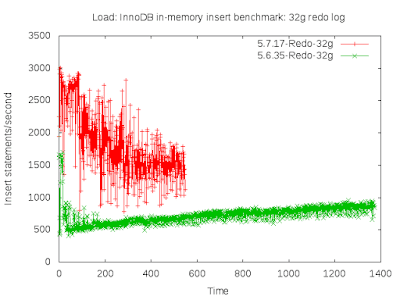
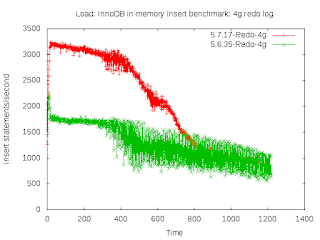
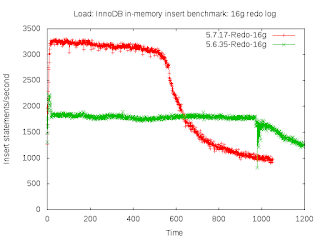
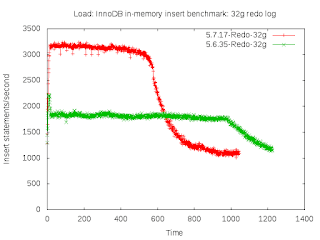
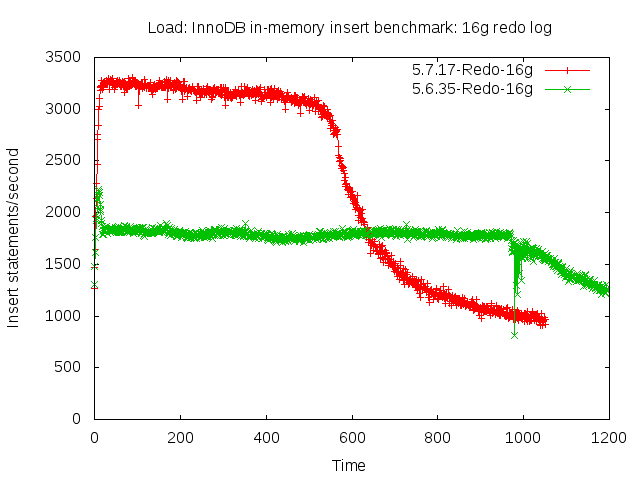
In-memory throughput over time
The results above show average throughput and that hides a lot of interesting behavior. We expect throughput over time to not suffer from variance -- for both InnoDB and for MyRocks. For many of the results below there is a lot of variance (jitter).
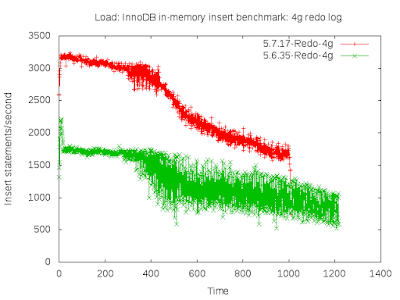
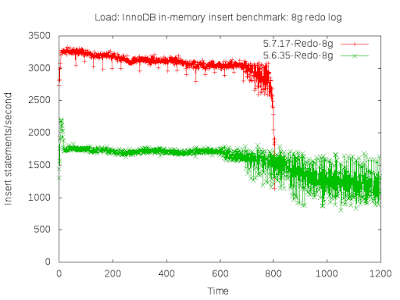
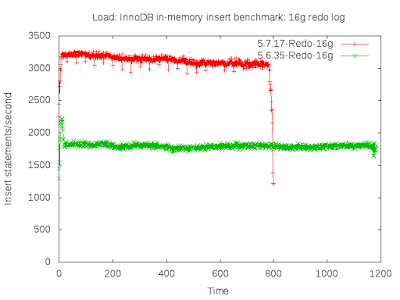
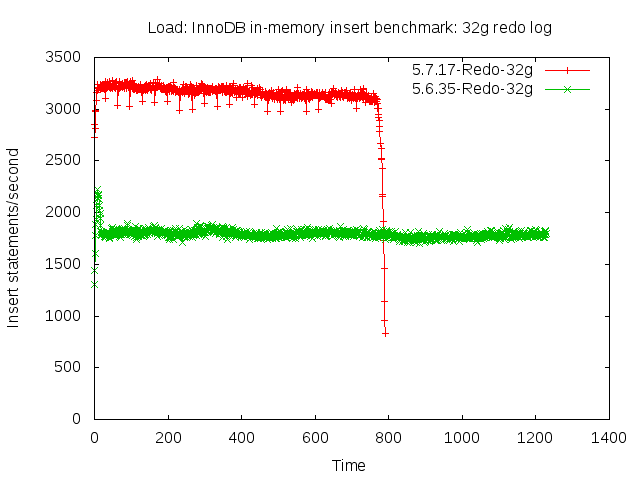
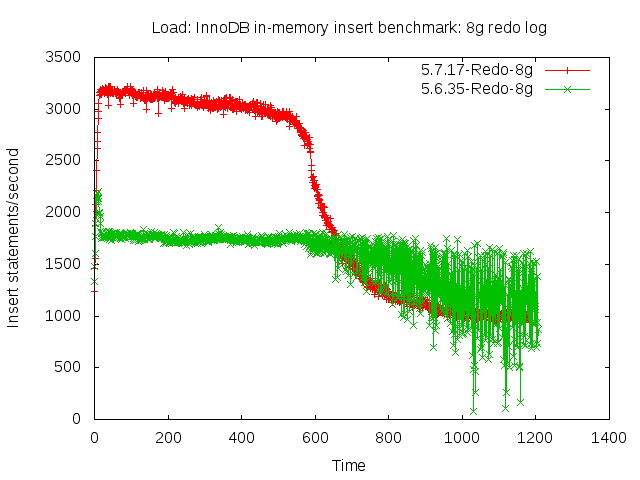
Fast SSD
InnoDB suffers from jitter with 4gb and 8gb redo logs and the problem is much worse for 5.6.35. Another problem occurs with a 4gb redo log -- throughput drops over time. That problem repeats for an 8gb redo log with 5.6.35.

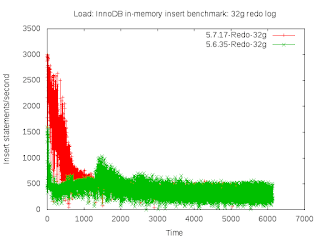
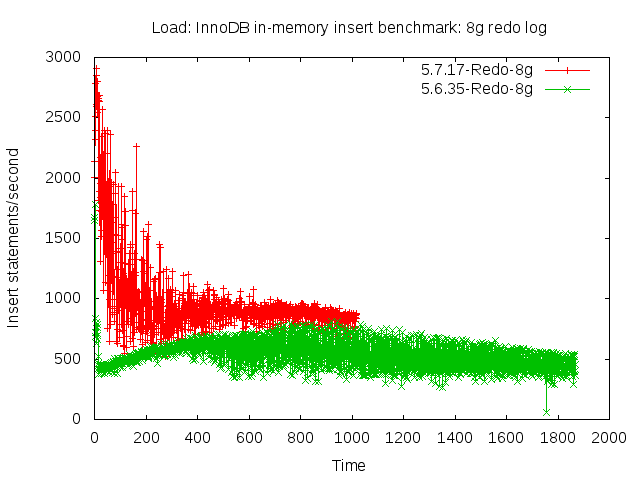
Slow SSD
With slow SSD jitter is much worse for 5.7.17 than for 5.6.35 and the difference is more significant with the larger redo log. Throughput also drops over time for 5.7.17. This is a surprising result.
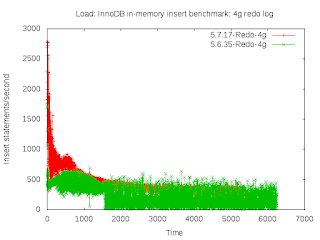
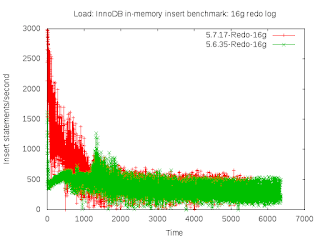
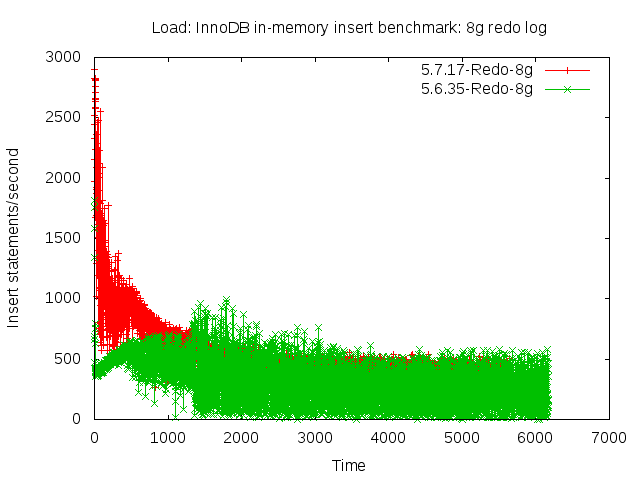
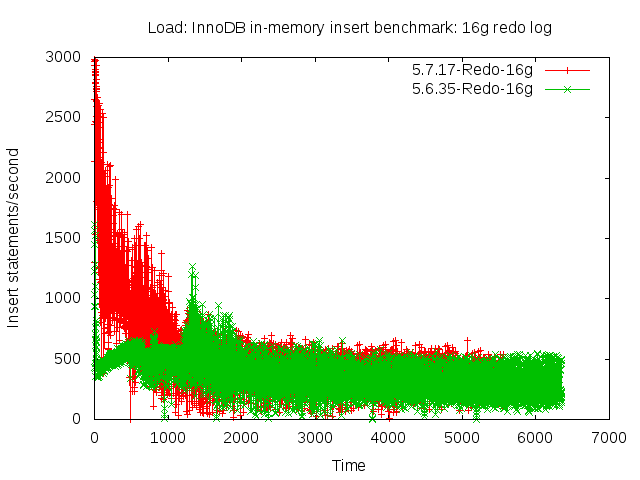
IO-bound throughput over time
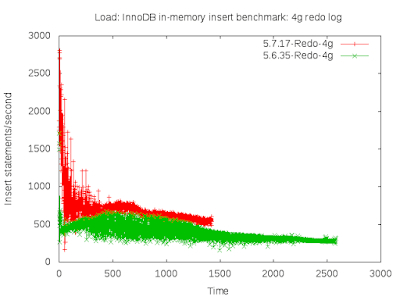
Fast SSD
MySQL 5.6.35 suffers from jitter while 5.7.17 suffers from throughput dropping over time. Although the drop in 5.7 might be reasonable assuming this occurs because the working set doesn't fit in cache and storage reads must be done during index maintenance. It is also interesting that 5.7.17 becomes as slow as 5.6.35 over time.

Slow SSD
Both 5.6.35 and 5.7.17 suffer from jitter.

Читать дальше...
Using a large InnoDB redo log can help performance but it comes at a cost. I have been using a 4gb redo log in my tests because that is what we frequently use in production. Dimitri mentioned using a 32gb redo log to show great throughput for InnoDB in recent releases. Here I share results from the insert benchmark with a 4gb, 8gb, 16gb and 32gb redo log.
tl;dr - conclusions specific to my test
- A larger redo log improves throughput
- A larger redo log helps more with slower storage than with faster storage because page writeback is more of a bottleneck with slower storage and a larger redo log reduces writeback.
- A larger redo log can help more when the working set is cached because there are no stalls from storage reads and storage writes are more likely to be a bottleneck.
- InnoDB in MySQL 5.7.17 is much faster than 5.6.35 in all cases except IO-bound + fast SSD
Configuration
I used my insert benchmark client with two test servers -- one with slow SSD that does ~10k IOPs and one with fast SSD that does more than 100k IOPs. Both servers have 24 cores, 48 HW-threads and 256gb of RAM. Tests were repeated for an in-memory workload (insert 500m rows) and an IO-bound workload (limit server RAM to 50gb and insert 2b rows). The test used 16 tables, 16 clients and each client inserted rows to a different table. Typical command line were:
# insert 500m rows
bash iq.sh innodb "" /path/to/bin/mysql /path/to/datadir md2 \
1 16 no no no 0 no 500000000
# insert 2b rows
bash iq.sh innodb "" /path/to/bin/mysql /path/to/datadir md2 \
1 16 no no no 0 no 2000000000
Test were run with upstream MySQL 5.6.35 and 5.7.17. I used these my.cnf files for 5.7.17 and 5.6.35. I compiled MySQL from source and used jemalloc. The benchmark client ran on the same host as mysqld to remove variance from the network. The binlog is enabled but sync on commit is disabled for InnoDB and the binlog to support faster insert rates.
In-memory load
For the in-memory load the redo log size has more impact with slow SSD than with fast SSD. From the In-memory load metrics section below you can see the benefit from a larger redo log. It reduces the amount of data written to storage per insert by more than half (see the wKB/i column) when going from a 4gb to a 32gb redo log. For fast SSD with 5.7.17, InnoDB writes to storage 5.31 KB/insert with a 4gb redo log versus 1.66 KB/insert with a 32gb redo log. Similar reductions occur for slow SSD and for 5.6.35. The larger redo log helps slow SSD more than fast SSD based on the reduction in wKB/i.


In-memory load metrics
Legend:
- ips.av, ips.99 - average and p99 insert rates. The 99th percentile is computed from the per-interval rates where the interval is ~10 seconds.
- wKB/i, rKB/i - KB written to and KB read from storage per inserted row. Measured by iostat.
- r/i - storage reads per inserted row. Measured by iostat.
- Mcpu/i - relative CPU overhead per inserted row. Measured by vmstat us and sy columns.
- size - database size in GB at test end
- rss - mysqld RSS in GB at test end
- wMB/s, rMB/s - average MB/second written to and read from storage. Measured by iostat.
- r/s - average storage reads/second. Measured by iostat.
- cpu - average CPU utilization. Measured by vmstat us and sy columns.
- engine - database engine. none means that no compression was used. 150g and 35g are the size of the InnoDB buffer pool. redoX is the size of the InnoDB redo log.
Fast SSD
ips.av ips.99 wKB/i Mcpu/i size rss wMB/s cpu engine
232666 9925 5.31 176 97 104.4 1235.1 41.0 inno5717.none.150g.redo4
286041 16559 3.46 162 97 104.1 989.0 46.4 inno5717.none.150g.redo8
292740 17587 2.41 157 97 104.3 706.5 46.0 inno5717.none.150g.redo16
295683 18009 1.66 154 97 104.1 490.6 45.5 inno5717.none.150g.redo32
92404 3504 5.11 201 97 106.2 472.5 18.6 inno5635.none.150g.redo4
134844 5987 2.97 192 97 106.1 400.8 25.8 inno5635.none.150g.redo8
169319 9247 2.02 176 97 106.1 342.5 29.8 inno5635.none.150g.redo16
171116 10165 1.74 175 97 106.2 297.9 30.0 inno5635.none.150g.redo32
Slow SSD
ips.av ips.99 wKB/i Mcpu/i size rss wMB/s cpu engine
68672 3277 4.95 165 97 104.4 339.9 11.3 inno5717.none.150g.redo2
95896 4518 2.67 154 97 104.4 256.4 14.7 inno5717.none.150g.redo4
131787 5868 1.47 135 97 104.4 194.2 17.8 inno5717.none.150g.redo8
177179 7231 0.85 130 97 104.3 151.3 23.0 inno5717.none.150g.redo16
38058 1691 5.01 176 97 106.3 190.6 6.7 inno5635.none.150g.redo2
52493 2537 2.74 156 97 106.3 144.0 8.2 inno5635.none.150g.redo4
61043 2660 1.64 151 97 106.3 100.2 9.2 inno5635.none.150g.redo8
71317 2914 1.26 145 97 106.3 89.5 10.3 inno5635.none.150g.redo16
IO-bound load
For the IO-bound load and fast SSD the redo log size has little impact for 5.7.17 and some impact for 5.6.35. For slow SSD the redo log size has more impact. But compared to the in-memory results above the impact from redo log size is much less for the IO-bound workload. From the IO-bound load metrics section below the reduction in wKB/i is less for IO-bound than for in-memory workloads but increasing the redo log from 4gb to 32gb still reduces the write rate in half for slow SSD per the wKB/i column.
Per the ips.av column InnoDB with 5.7.17 isn't much faster than 5.6.35 for the fast SSD. It is still much faster for the slow SSD.


IO-bound load metrics
Fast SSD
ips.av ips.99 r/i rKB/i wKB/i Mcpu/i size rss r/s rMB/s wMB/s cpu engine
61711 3353 0.09 1.48 14.65 562 402 4.0 5698 91.2 904.3 34.7 inno5717.none.35g.redo2
62929 3471 0.09 1.47 11.39 546 402 4.0 5771 92.3 717.0 34.4 inno5717.none.35g.redo4
63593 2542 0.10 1.54 11.01 554 404 4.0 6133 98.1 700.2 35.2 inno5717.none.35g.redo8
63959 3419 0.09 1.43 10.11 535 402 4.0 5732 91.7 646.6 34.2 inno5717.none.35g.redo16
45874 1790 0.11 1.71 11.25 585 402 43.2 4915 78.6 516.0 26.8 inno5635.none.35g.redo2
58682 2500 0.10 1.55 8.57 589 403 43.2 5667 90.7 502.8 34.6 inno5635.none.35g.redo4
59179 2285 0.10 1.52 8.30 581 402 43.2 5607 89.7 491.2 34.4 inno5635.none.35g.redo8
59312 2473 0.10 1.56 8.36 593 403 43.2 5776 92.4 495.7 35.2 inno5635.none.35g.redo16
Slow SSD
ips.av ips.99 r/i rKB/i wKB/i Mcpu/i size rss r/s rMB/s wMB/s cpu engine
34101 1975 0.10 1.60 10.91 402 400 39.7 3412 54.6 372.0 13.7 inno5717.none.35g.redo2
46712 1837 0.09 1.49 7.29 433 403 39.9 4362 69.8 340.7 20.2 inno5717.none.35g.redo4
45231 1649 0.10 1.54 5.34 420 404 40.0 4355 69.7 241.5 19.0 inno5717.none.35g.redo8
49244 1750 0.10 1.56 6.39 454 403 40.0 4803 76.9 314.5 22.4 inno5717.none.35g.redo16
17654 605 0.18 2.79 12.22 448 398 43.2 3083 49.3 215.7 7.9 inno5635.none.35g.redo2
26607 863 0.12 1.86 7.56 438 402 43.2 3099 49.6 201.2 11.7 inno5635.none.35g.redo4
28069 1143 0.09 1.51 5.50 398 403 43.2 2650 42.4 154.2 11.2 inno5635.none.35g.redo8
30734 1276 0.09 1.50 5.01 407 403 43.2 2882 46.1 153.9 12.5 inno5635.none.35g.redo16
In-memory throughput over time
The results above show average throughput and that hides a lot of interesting behavior. We expect throughput over time to not suffer from variance -- for both InnoDB and for MyRocks. For many of the results below there is a lot of variance (jitter).
Fast SSD
InnoDB suffers from jitter with 4gb and 8gb redo logs and the problem is much worse for 5.6.35. Another problem occurs with a 4gb redo log -- throughput drops over time. That problem repeats for an 8gb redo log with 5.6.35.


Slow SSD
With slow SSD jitter is much worse for 5.7.17 than for 5.6.35 and the difference is more significant with the larger redo log. Throughput also drops over time for 5.7.17. This is a surprising result.


IO-bound throughput over time
Fast SSD
MySQL 5.6.35 suffers from jitter while 5.7.17 suffers from throughput dropping over time. Although the drop in 5.7 might be reasonable assuming this occurs because the working set doesn't fit in cache and storage reads must be done during index maintenance. It is also interesting that 5.7.17 becomes as slow as 5.6.35 over time.


Slow SSD
Both 5.6.35 and 5.7.17 suffer from jitter.


Читать дальше...